Astronomers just revealed something wild: a massive 3D map of the early universe showing galaxies and gas clouds that were invisible until now.
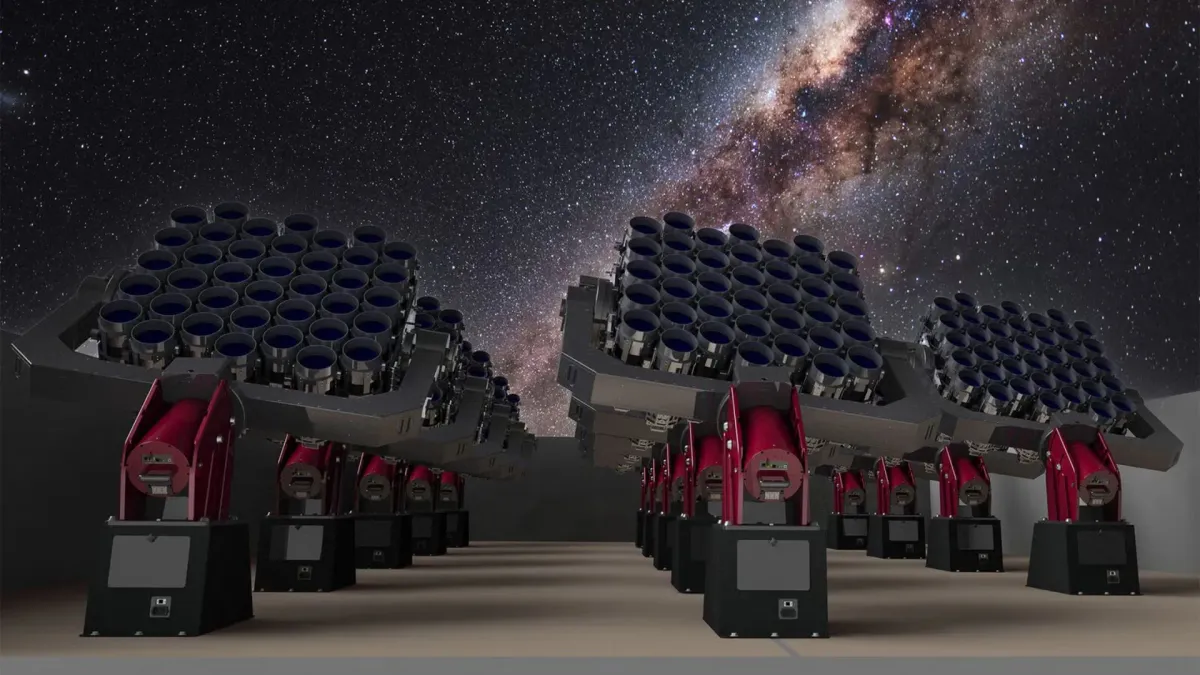
The discovery comes from the Hobby-Eberly Telescope, which spent years staring at a patch of sky roughly 2,000 times the size of the full Moon. What they found was light from between 9 and 11 billion years ago—a period when the universe was still young. That light, called Lyman alpha, is produced when hydrogen gets energized by nearby stars. The problem: most of this light comes from galaxies too faint to spot one at a time. It's like trying to count individual stars in a distant city at night—the brightest ones stand out, but the rest blur into darkness.
So the team tried something different. Instead of hunting for individual galaxies, they measured how strongly this light appeared across entire regions of space at once. Think of it like the difference between trying to map a city by finding each building individually versus looking at the whole glow of lights from an airplane. You get a blurrier picture, but you actually see everything—not just the skyscrapers.
We're a new kind of news feed.
Regular news is designed to drain you. We're a non-profit built to restore you. Every story we publish is scored for impact, progress, and hope.
Start Your News DetoxA New Way to See the Invisible
This technique, called Line Intensity Mapping, isn't brand new. But using it to map this particular light signal at this scale and precision? That's never been done before. The Hobby-Eberly collected over 600 million spectra—essentially light fingerprints—across the sky. The researchers only needed about 5% of that data for their main project. The rest was sitting there, waiting.
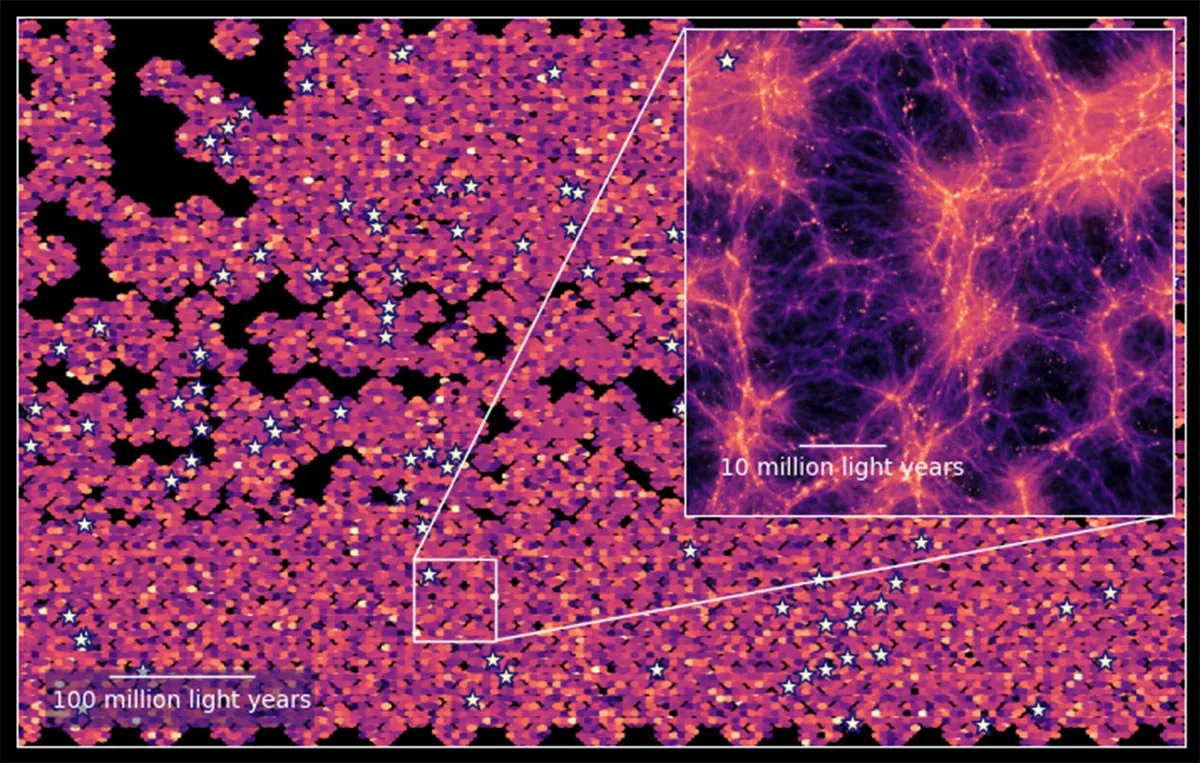
"There's a whole sea of light in the seemingly empty patches in between," said Maja Lujan Niemeyer, the scientist who led the map's development at the Max Planck Institute for Astrophysics. "Those galaxies are only the tip of the iceberg."
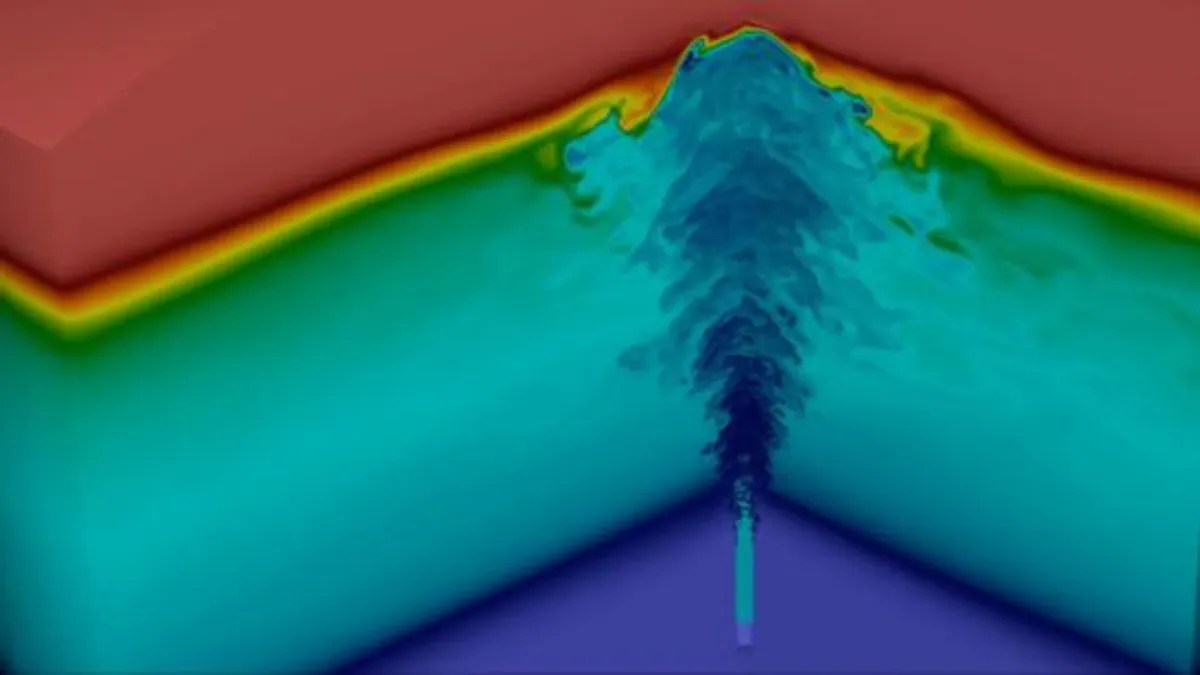
To actually build the map, the team fed roughly half a petabyte of observations into supercomputers at the Texas Advanced Computing Center. Here's the clever part: they used the locations of bright galaxies they already knew about as signposts. Since gravity pulls matter into clusters, a bright galaxy usually means fainter ones are hanging nearby. That let them estimate where the invisible stuff was hiding.
The result is a sharpened view of the cosmic web—the filaments and clusters of matter that hold the universe together. For the first time, astronomers can see not just the bright nodes of this web, but the dimmer threads connecting them. "We have computer simulations of this period," explained Eiichiro Komatsu, scientific director at Max Planck. "But those are just simulations. Now we have a foundation to check if the astrophysics behind them is actually correct."
What Comes Next
The team plans to compare this map with surveys looking at the same cosmic neighborhood but tracking different elements—like carbon monoxide, which marks the cold clouds where stars are born. Layering these maps together could reveal how young stars form and what environments spark the intense hydrogen light they're tracking.
For context, this is the first time intensity mapping has been used this way on this much data. The door is officially open to a new era of cosmic cartography.