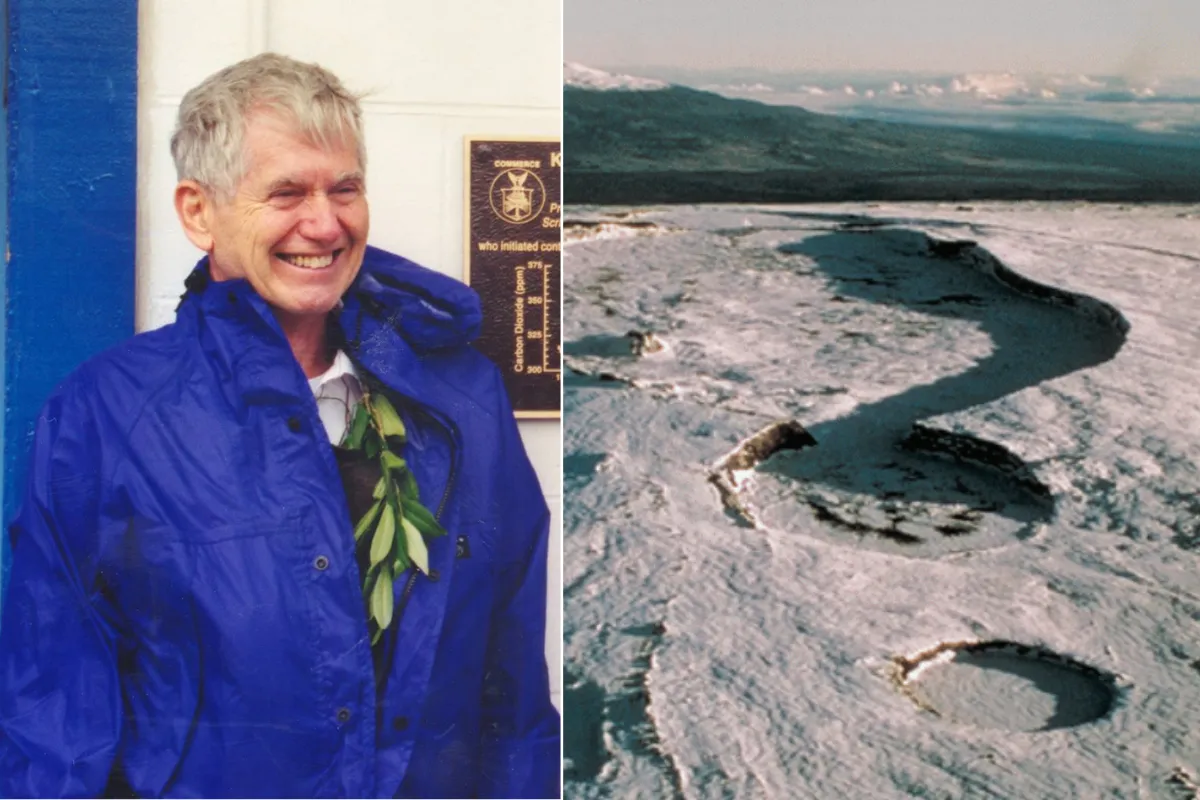
In 1958, Charles David Keeling arrived at a volcano in Hawaii with an idea so simple it almost seemed silly: fill glass flasks with air from the same spot every single day. For over 60 years, this repetitive, unglamorous work became one of the most important scientific projects ever completed.
Keeling's timing mattered. Before him, scientists had collected air samples from around the globe, but never consistently. A British engineer named Guy Stewart Callendar had looked at these scattered datasets and concluded that burning fossil fuels was raising atmospheric carbon dioxide. The scientific community wasn't convinced. Without measurements from the same place, at the same times, there was no solid baseline to prove he was right.
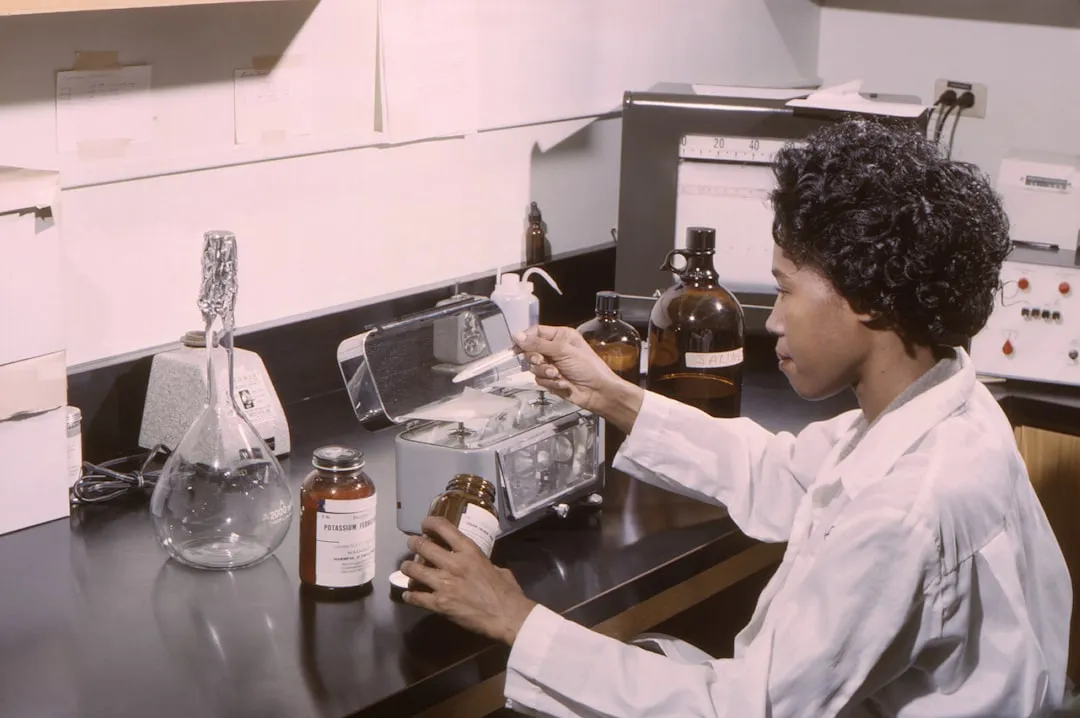
Keeling's approach was radical for its era. He set up shop at Mauna Loa Observatory on Hawaii's Big Island—remote enough to avoid car exhaust and factory smoke. The actual process sounded almost comedic: researchers would take a volleyball-shaped glass flask that had been completely vacuumed of air, hold their breath, walk into the wind, and open a valve to let air rush in. Yet Keeling obsessed over precision in ways no one had before, capturing atmospheric measurements more accurate than anything the world had seen.
We're a new kind of news feed.
Regular news is designed to drain you. We're a non-profit built to restore you. Every story we publish is scored for impact, progress, and hope.
Start Your News Detox
What the Data Revealed
Once Keeling had enough samples, two discoveries emerged. The first was surprising but elegant: carbon dioxide levels weren't steady. They rose and fell daily, and followed distinct seasonal rhythms.
Plants pull CO2 from the air during photosynthesis. In the Northern Hemisphere's summer, when vegetation explodes with growth, CO2 levels drop as plants inhale the gas. Come winter, as plants die back and decay, they exhale CO2 back into the atmosphere. The Southern Hemisphere does the opposite. This simple observation cracked open Earth's entire carbon cycle—how carbon moves through soil, oceans, air, and living things. Suddenly scientists could build models to predict how human activity would reshape the planet.
The second discovery was far grimmer. Baseline CO2 levels weren't just fluctuating—they were climbing every single year. Keeling sketched out what became known as the "Keeling Curve," a graph that looks less like a curve than a line marching steadily upward and to the right.
That graph became the first undeniable visual proof of human-caused climate change. As CO2 traps more heat, the atmosphere warms, ice melts, seas rise, and weather turns more extreme. Many scientists rank it among the most significant discoveries of the last century.
Keeling wasn't building this alone. Callendar's early hunch had been right all along—Keeling's data confirmed it. Irish scientist John Tyndall had discovered back in 1861 that certain gases could trap heat (the "greenhouse effect"). An amateur scientist named Eunice Newton Foote had actually shown these principles even earlier, though history largely forgot her. And a Flemish alchemist named Jan Baptista van Helmont had identified carbon dioxide as a distinct gas centuries before anyone else.
The work at Mauna Loa continues today, making it one of the longest unbroken atmospheric studies on record. If anything, it's become more urgent. Every year that passes, the upward curve Keeling first drew keeps climbing—a visual record of the problem he helped us finally see.