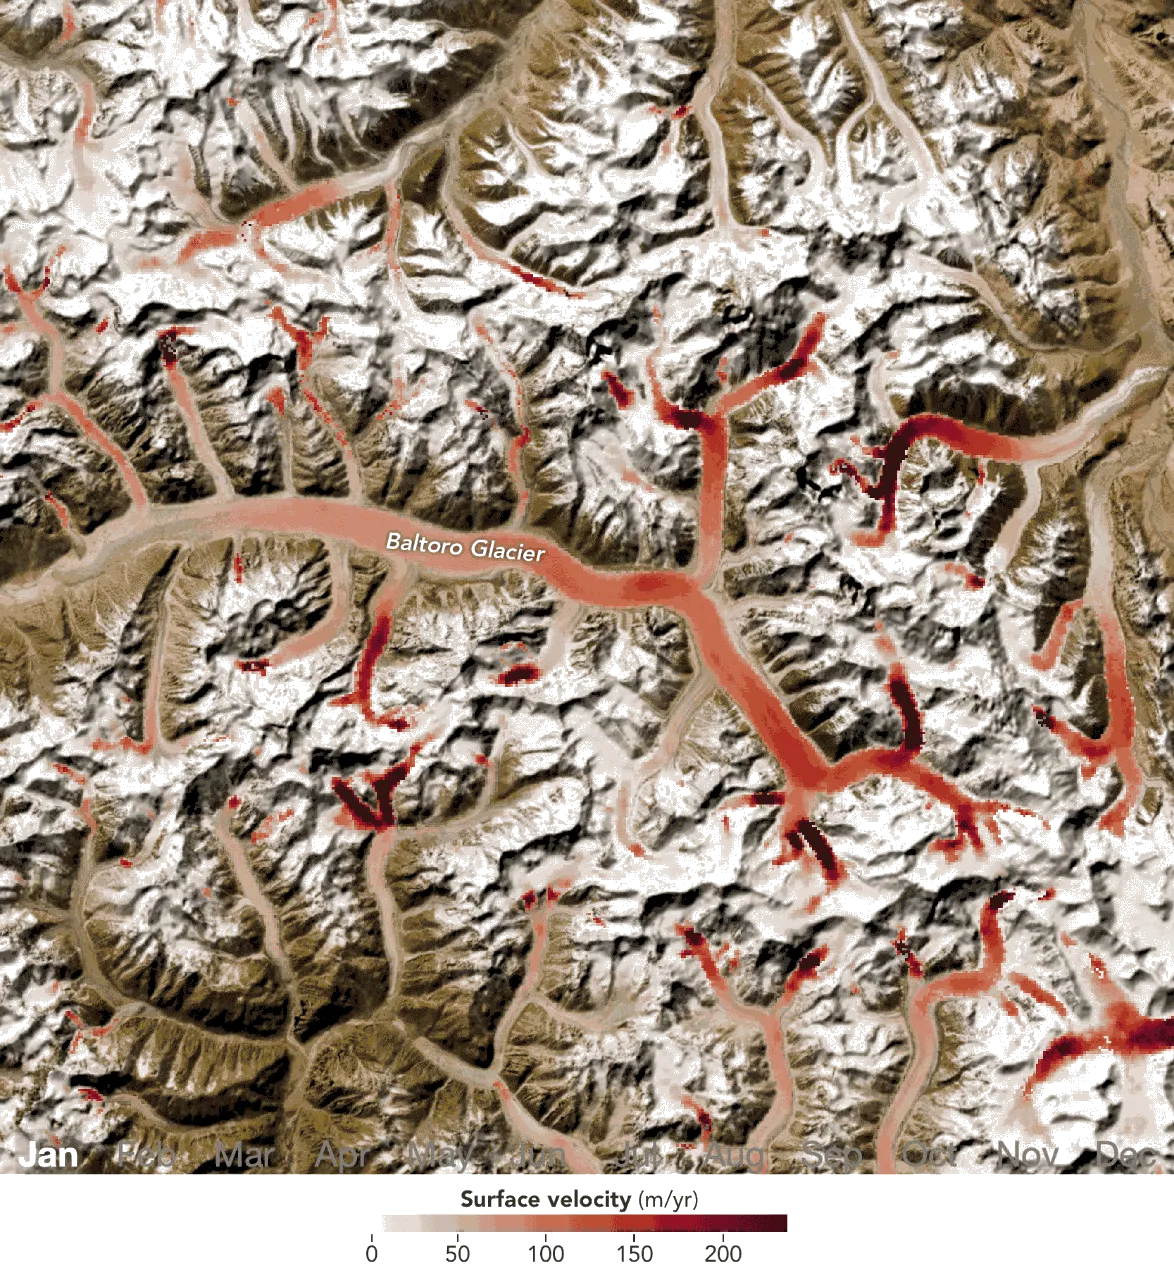
For the first time, researchers have created a complete global picture of how glaciers pulse with the seasons. Published in Science in November 2025, the study analyzed over 36 million satellite image pairs—decades of Landsat data combined with radar—to track the seasonal rhythm of nearly every major glacier on Earth.
The work builds on NASA's ITS_LIVE ice velocity dataset and reveals something striking: as the planet warms, these seasonal swings are becoming more dramatic. Glaciers in regions where temperatures regularly exceed freezing now show much sharper seasonal variations than they did before. This matters because it means we can now see patterns that were invisible when looking at individual glaciers or single regions.
Why this changes how we understand glaciers
Previous studies typically focused on one glacier or a handful of them in a specific area. That made it nearly impossible to know whether what you learned in Alaska applied to the Himalayas or Greenland. This study applied the same method to glaciers worldwide, revealing universal relationships that drive seasonal flow changes everywhere.
We're a new kind of news feed.
Regular news is designed to drain you. We're a non-profit built to restore you. Every story we publish is scored for impact, progress, and hope.
Start Your News DetoxThe key insight: a glacier's response to warming depends heavily on local geology and hydrology. A glacier sitting on bedrock behaves differently from one on softer material. The shape of the valley matters. The fjord it drains into matters. By mapping all of this at once, researchers can now account for these differences instead of guessing.
How they actually tracked this
Landsat satellites have been orbiting Earth since the 1980s, returning to the exact same position with remarkable consistency. This matters because detecting glacier movement requires spotting tiny pixel shifts—sometimes just a few meters—between images taken weeks or months apart. Landsat's stable orbit, its direct downward view, and its minimal distortion make this possible in ways other satellites can't match.
But Landsat alone isn't enough. During summer, when glacier surfaces turn wet and slushy, optical sensors like Landsat struggle. Radar satellites, which work day or night through clouds, take over. Radar can't track features as well during melt season, but optical sensors excel at it. Together, they create a complete timeline.
The researchers validated their measurements by checking them against bedrock—surfaces that shouldn't move at all. If the data showed movement where there should be none, they knew their uncertainty was higher. This kind of honesty about limitations is how you build trust in a dataset.
What comes next
Landsat 9 data is already flowing into the system. Future satellites will offer a choice: higher resolution to track more surface features, or faster repeat visits to catch rapid changes. Each option has trade-offs—more frequent images mean smaller displacements to measure, which can actually introduce error. The researchers are already thinking through these puzzles as new sensors launch.
The dataset itself is now open. Scientists worldwide are beginning to explore it, looking for patterns in glacier mechanics that nobody has spotted yet. This is what happens when you map something comprehensively for the first time—you don't just answer the original question. You create a foundation for questions you didn't know to ask.