
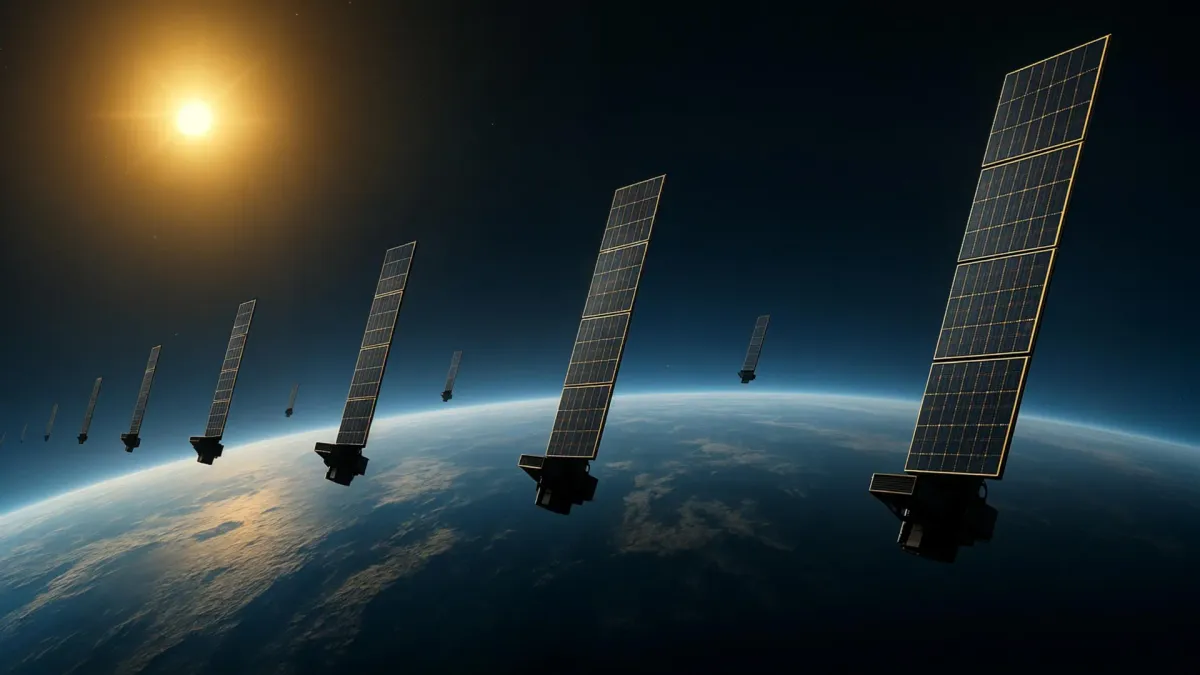
Researchers have found a new way to map a hard-to-see part of Earth's upper atmosphere. They used data from about 1,200 Starlink satellites. This helped them understand changes in atmospheric density roughly 500 kilometers above Earth.
This method could make tracking satellites better. It might also help lower the risk of crashes in space, where more and more objects are orbiting.
Seeing the Thermosphere
The area around Earth is getting busier with thousands of satellites and space junk. High above, at several hundred kilometers, tiny bits of Earth's upper atmosphere can still slow satellites down. Knowing the exact density of the atmosphere at these heights is key. It helps predict where satellites will go and reduces collision risks.
We're a new kind of news feed.
Regular news is designed to drain you. We're a non-profit built to restore you. Every story we publish is scored for impact, progress, and hope.
Start Your News DetoxMost of the upper atmosphere, over 99%, is made of neutral gas called the thermosphere. Thermospheric density is how dense this neutral air is between 100 and 1000 kilometers up. In contrast, the ionosphere is ionized gas and makes up less than 1% of the atmosphere. Because ionized gas affects radio waves, it's easier to study.
Measuring conditions in the thermosphere is much harder.
Better measurements of the thermosphere could help research into the upper atmosphere. It would also give useful information for space engineering. Kyoto University researchers created a new way to visualize this difficult region.
Mamoru Yamamoto, a lead author, said this study combines space science and space engineering. He noted that researchers from both fields need to talk more.
The team used public orbital data from Starlink satellites. They applied tomography, a method like medical imaging, to Earth's upper atmosphere. By looking at how atmospheric drag slowly changes satellite orbits, they estimated the thermospheric density. This was done for about 1,200 satellites flying at 482 kilometers high.
Mapping the Atmosphere
With these measurements, the researchers made a two-dimensional map. It showed thermospheric density across latitude and longitude at about 500 kilometers altitude. This is the first time such a tomographic analysis has been done.
The density patterns matched observations from the European Space Agency's SWARM satellites. These satellites measure atmospheric density changes along their paths.
This new work builds on an earlier study by the same team. In that study, scientists estimated how thermospheric density changed over time and height. They used general orbital information called Two-Line Element (TLE) data from Starlink satellites. The new analysis adds a horizontal view, showing how density changes across different locations. This reveals more about the thermosphere's structure.
Making Space Safer
These findings could be very useful as more objects orbit Earth. More accurate information about atmospheric density can improve predictions of satellite movement. This helps reduce the chance of crashes between satellites and space debris.
This method could also eventually provide near-real-time measurements of atmospheric density around satellites. Such monitoring could improve space weather forecasts. It would also help make satellite operations safer and more reliable in the future.
Deep Dive & References
Tomography of thermospheric density from Starlink Ephemeris: initial report - Earth, Planets and Space, 2026